SIP vs FD: Which Builds More Wealth in 2026?
Sanjay Singh
Published on 20 Jun 2026 • Updated on 30 Sept 2026
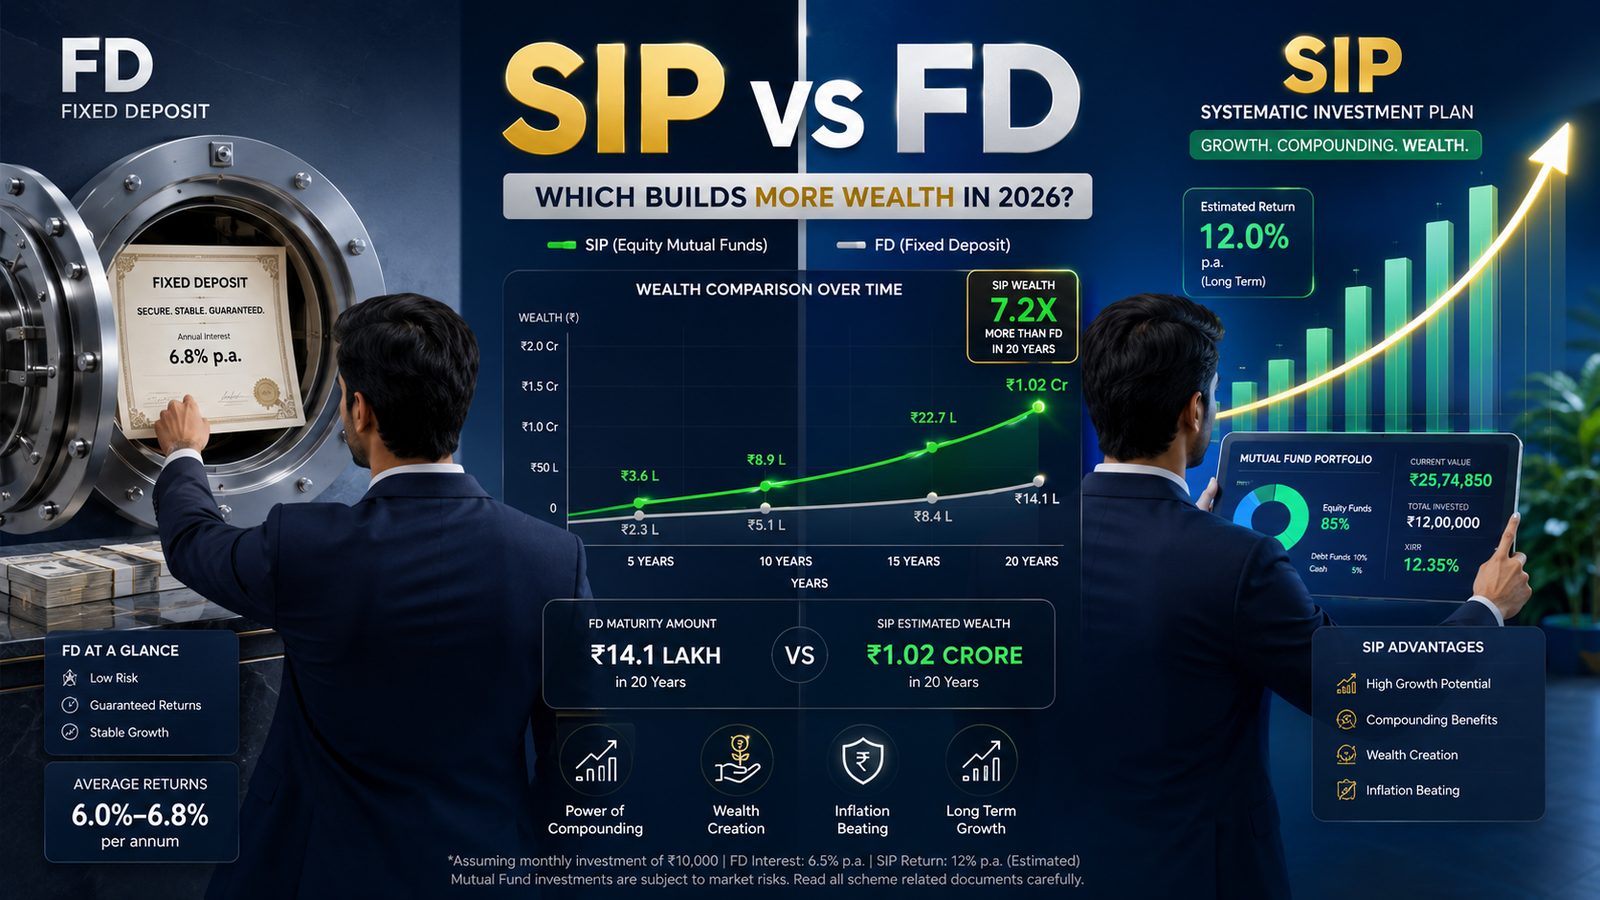
SIP vs FD: Which Builds More Wealth in 2026?
A relative of mine retired from a public sector bank in 2019 with a fixed deposit ladder he'd built over 30 years. He was proud of it, and he had every right to be — it was disciplined, careful money management. But when I ran the numbers with him last year, he was stunned to learn that a colleague who'd split the same monthly savings between SIPs and FDs had ended up with nearly double the corpus, despite investing the exact same amount every month.
That conversation is the reason this article exists. SIP vs FD isn't a question with one right answer. It's a question with a right answer for your situation, and most of the content online doesn't bother making that distinction. It just picks a side.
Quick Answer: SIP vs FD, Which Is Better?
SIP in equity mutual funds has historically generated higher returns than fixed deposits over long horizons (10+ years), making it stronger for wealth creation. FDs offer guaranteed, fixed returns with capital protection, making them better for short-term goals, emergency funds, and risk-averse investors. Neither is universally "better" — the right choice depends on your time horizon, risk tolerance, and what the money is actually for.
Why Millions of Investors Keep Comparing SIP and FD
These two products dominate the personal finance conversation in India for a simple reason: they're the two instruments almost every working adult has actually used. Your first FD was probably opened by a parent before you could vote. Your first SIP probably started the week after your first salary credit, nudged along by a colleague or a banking app notification.
They also sit at opposite ends of the same spectrum — one trades certainty for modest growth, the other trades short-term comfort for long-term compounding. That tension is exactly what makes the comparison so sticky. Nobody asks "FD vs real estate" with the same urgency, because those two don't compete for the same rupee in your monthly budget the way SIP and FD do.
The Biggest Mistake People Make When Comparing SIP and FD
Here's where almost every comparison article — and almost every WhatsApp forward — gets it wrong: they compare a monthly SIP against a lump-sum FD as if the two structures are interchangeable.
They're not. A Fixed Deposit is, by definition, a one-time lump-sum investment locked for a fixed tenure. If you're investing money monthly and comparing it to an FD, what you're actually comparing it to — structurally — is a Recurring Deposit (RD), not a traditional FD. The two earn similar interest rates at the same bank, but the monthly contribution structure of an RD mirrors a SIP far more accurately than a lump-sum FD does.
This matters because people frequently make decisions using mismatched math: they calculate FD returns assuming the full amount was invested on day one, then compare that inflated number against a SIP that built up gradually over years. That's not a fair fight, and it quietly biases the comparison toward FDs in a way that doesn't reflect reality.
Every monthly comparison in this article uses RD-equivalent compounding for the FD side — meaning the deposit grows the same way a SIP does, contribution by contribution, just at fixed deposit interest rates instead of market-linked returns. That's the only way to make this an honest comparison. (Note: most Indian banks compound RDs quarterly rather than monthly, which can shave a small amount off real-world RD returns compared to the monthly-compounding figures shown here — worth keeping in mind if you're comparing actual bank quotes.)
Table 1: SIP vs FD — Quick Comparison
| Factor | SIP (Equity Mutual Fund) | FD (Fixed Deposit) |
|---|---|---|
| Returns | Market-linked, typically 10-15% historically (not guaranteed) | Fixed, typically 6-8% currently |
| Risk | Moderate to high, market volatility | Very low, principal protected |
| Best for | Long-term wealth creation (10+ years) | Short-term goals, capital safety |
| Minimum investment | As low as ₹100-500/month | Varies by bank, usually ₹1,000+ |
| Liquidity | High (open-ended funds, though exit loads may apply) | Low (penalty on premature withdrawal) |
| Inflation protection | Generally outpaces inflation long-term | Often barely matches or lags inflation |
| Taxation | LTCG 12.5% above ₹1.25 lakh/year; STCG 20% | Interest taxed at income slab rate |
| Guarantee | None — returns fluctuate with markets | Bank-guaranteed rate; DICGC insures up to ₹5 lakh |
Feature-by-Feature Breakdown
Table 2: Detailed Feature Comparison
| Feature | SIP | FD |
|---|---|---|
| Investment structure | Periodic (monthly/weekly/quarterly) | Mostly lump sum (RD allows monthly) |
| Underlying asset | Equity, debt, or hybrid mutual fund units | Bank deposit |
| Return type | Variable, market-linked | Fixed, pre-determined |
| Flexibility | Can pause, increase, or stop anytime | Locked until maturity (penalty applies otherwise) |
| Compounding frequency | Daily NAV-based | Usually quarterly (banks) |
| Ideal holding period | 7+ years for equity exposure to smooth volatility | Matches your chosen tenure (7 days to 10 years) |
| Suitable for beginners | Yes, with guidance on fund selection | Yes, no selection skill needed |
| Regulatory oversight | SEBI | RBI |
Table 3: Risk Comparison
| Risk Type | SIP | FD |
|---|---|---|
| Market risk | High (equity-linked SIPs can see negative years) | None |
| Credit/default risk | Low for established AMCs, fund-specific | Low for banks; higher for some NBFC/corporate FDs |
| Inflation risk | Lower over long horizons | Higher, especially at current 6-7% FD rates |
| Liquidity risk | Low (can redeem, though may incur exit load) | Moderate (premature withdrawal penalty, often ~1%) |
| Reinvestment risk | Low (continuous contribution) | High (rates may drop when you reinvest at maturity) |
Table 4: Liquidity Comparison
| Aspect | SIP | FD |
|---|---|---|
| Withdrawal process | Online redemption, usually credited in 1-3 business days | Premature closure request, often same-day but with penalty |
| Penalty for early exit | Exit load (typically 0.5-1% if redeemed within 1 year, fund-dependent) | Typically ~1% interest reduction on premature withdrawal |
| Partial withdrawal | Yes, redeem any portion anytime | Usually not — most FDs require full premature closure |
| Best use case for liquidity needs | Medium-term goals where some flexibility helps | Emergency funds with a known small penalty trade-off |
Taxation: Where a Lot of the "Real" Return Gets Decided
This is the part that decides who actually walks away with more money, and it's the part most casual comparisons skip entirely.
FD interest is added to your total income and taxed at your applicable income tax slab rate — there's no special concessional rate, no exemption threshold for the gain itself. Banks deduct TDS once your annual interest crosses ₹50,000 for general depositors (₹1,00,000 for senior citizens), but TDS isn't the final tax — your actual liability still depends on your slab.
Equity-oriented SIPs get materially better tax treatment if held long enough. Gains on units held over 12 months qualify as long-term capital gains, taxed at 12.5%, with the first ₹1.25 lakh of such gains exempt every financial year. Sell within 12 months, and you're taxed at 20% as short-term capital gains instead — still often better than a high FD slab rate, but you lose the exemption benefit.
Table 5: Taxation Comparison
| Aspect | SIP (Equity Fund) | FD |
|---|---|---|
| Tax on gains held <12 months | 20% (STCG) | Slab rate (same regardless of tenure) |
| Tax on gains held >12 months | 12.5% (LTCG), above ₹1.25 lakh exemption/year | Slab rate (no long-term concession) |
| TDS | None on equity fund redemption | Deducted above ₹50,000 interest/year (₹1,00,000 for senior citizens) |
| Exemption available | ₹1.25 lakh LTCG exemption per financial year | None |
| Effective tax for a 30% slab investor | 12.5% (LTCG) or 20% (STCG) | 30% flat on all interest |
Callout: A taxpayer in the 30% slab effectively pays more than double the tax rate on FD interest compared to long-term SIP gains. This single difference can be worth lakhs of rupees over a multi-decade horizon, independent of which product earns the higher headline return.
Real Return Comparison: What the Numbers Actually Show
Theory is fine, but most readers want to know what happens to their own money. Here are the actual numbers across common monthly amounts and time horizons. SIP figures use 10%, 12%, and 15% as illustrative return assumptions, reflecting the realistic range of historical equity mutual fund performance. FD/RD figures use 6%, 7%, and 8%, reflecting the current spread of bank fixed deposit rates in 2026 — major banks like SBI, HDFC, and ICICI are currently in the 6.25%-7.5% range, while some small finance banks offer up to 8%.
Table 6: ₹5,000/Month for 10 Years
| Return Rate | SIP Future Value | Return Rate | FD/RD Future Value |
|---|---|---|---|
| 10% | ₹10,32,760 | 6% | ₹8,23,494 |
| 12% | ₹11,61,695 | 7% | ₹8,70,472 |
| 15% | ₹13,93,286 | 8% | ₹9,20,828 |
Total invested over 10 years: ₹6,00,000. At a 12% SIP return, the gain alone (₹5,61,695) is more than double the gain from a 7% FD (₹2,70,472) on the exact same contribution.
Table 7: ₹10,000/Month for 15 Years
| Return Rate | SIP Future Value | Return Rate | FD/RD Future Value |
|---|---|---|---|
| 10% | ₹41,79,243 | 6% | ₹29,22,728 |
| 12% | ₹50,45,760 | 7% | ₹31,88,112 |
| 15% | ₹67,68,631 | 8% | ₹34,83,451 |
Total invested: ₹18,00,000. The gap here is striking — at a 12% SIP return versus a 7% FD return, the SIP corpus is over ₹18.5 lakh higher, on identical monthly contributions.
Table 8: ₹20,000/Month for 20 Years
| Return Rate | SIP Future Value | Return Rate | FD/RD Future Value |
|---|---|---|---|
| 10% | ₹1,53,13,938 | 6% | ₹92,87,022 |
| 12% | ₹1,99,82,958 | 7% | ₹1,04,79,308 |
| 15% | ₹3,03,19,099 | 8% | ₹1,18,58,944 |
Total invested: ₹48,00,000. Over a 20-year horizon, a 12% SIP nearly doubles the 7% FD outcome — and that's before accounting for the tax advantage SIP gains carry over FD interest.
Table 9: Two More Common Scenarios
| Monthly SIP | Tenure | SIP @ 12% | FD/RD @ 7% | Total Invested |
|---|---|---|---|---|
| ₹15,000 | 20 years | ₹1,49,87,219 | ₹78,59,481 | ₹36,00,000 |
| ₹25,000 | 25 years | ₹4,74,40,877 | ₹2,03,69,928 | ₹75,00,000 |
Key takeaway from these tables: The gap between SIP and FD outcomes isn't linear — it widens dramatically as the time horizon stretches. Over 10 years, SIP roughly outperforms FD by 30-40%. Over 25 years, that gap can stretch to more than double. This is compounding rewarding patience disproportionately, and it's the single biggest reason horizon should drive your SIP vs FD decision more than anything else.
If you want to run your own numbers rather than relying on these illustrations, Numrexo's SIP Calculator and FD Calculator let you plug in your own monthly amount, tenure, and expected rate to see the comparison side by side.
Inflation-Adjusted Wealth Comparison: The Number That Actually Matters
A future value on paper means very little if you don't know what it'll actually buy. This is where FDs quietly lose ground that most comparisons never show.
Table 10: Inflation Impact Comparison (6% Assumed Inflation)
| Scenario | Nominal Future Value | Real Value (Today's Purchasing Power) |
|---|---|---|
| ₹20,000/month SIP, 20 yrs @ 12% | ₹1,99,82,958 | ₹62,30,781 |
| ₹20,000/month FD, 20 yrs @ 7% | ₹1,04,79,308 | ₹32,67,498 |
| ₹25,000/month SIP, 25 yrs @ 12% | ₹4,74,40,877 | ₹1,10,53,659 |
| ₹25,000/month FD, 25 yrs @ 7% | ₹2,03,69,928 | ₹47,46,165 |
The pattern holds across every horizon: SIP corpora retain roughly double the real purchasing power of equivalent FD corpora once inflation is factored in, because equity returns have historically run meaningfully ahead of inflation while FD rates often barely clear it — and in some years, don't clear it at all. An inflation calculator is worth running on any large goal you're planning more than a decade out, simply so the number you're targeting reflects what you'll actually need, not what feels like a big number today.
Tax-Adjusted Wealth Comparison: What You Actually Keep
Future value before tax is a vanity number. Here's the same ₹10,000/month, 15-year scenario from Table 7, adjusted for actual tax liability.
Table 11: Tax-Adjusted Comparison — ₹10,000/Month for 15 Years
| Instrument | Pre-Tax Gain | Tax Owed | Net Take-Home Corpus |
|---|---|---|---|
| SIP @ 12% (LTCG, ₹1.25L exemption applied) | ₹32,45,760 | ₹3,90,095 | ₹46,55,665 |
| FD @ 7% (30% tax slab) | ₹13,88,112 | ₹4,16,434 | ₹27,71,679 |
| FD @ 7% (20% tax slab) | ₹13,88,112 | ₹2,77,622 | ₹29,10,490 |
Even an investor in a lower 20% tax bracket still ends up nearly ₹17.5 lakh behind the SIP outcome on identical contributions, once both the return gap and the tax gap are accounted for together. This is the number that should actually drive decision-making — not the headline return rate, and not the pre-tax future value either.
Historical Returns: What the Data Actually Shows
Numbers projected forward are only useful if they're grounded in what's actually happened. The Nifty 50, India's benchmark equity index, has delivered a 20-year CAGR of roughly 11-13% on a Total Return basis (which includes reinvested dividends), based on NSE Indices data through early 2026. Rolling 10-year returns have historically ranged from around 11% to 14% depending on the exact entry and exit points, and rolling 15-year periods have rarely dipped below high single digits.
FD rates, by contrast, have moved in a much narrower band — generally 5.5% to 8% across the last several years for major banks, tracking RBI's repo rate cycle fairly closely.
Table 12: Historical Market Returns vs FD Returns
| Period | Nifty 50 Approx. CAGR | Typical Bank FD Rate (Same Period) |
|---|---|---|
| Last 10 years | ~11-14% | ~6-7.5% |
| Last 15 years | ~11-12% | ~6-8% |
| Last 20 years | ~11-13% | ~6.5-8.5% |
| Last 25 years | ~11-12% | ~6.5-9% |
Two things stand out. First, equity returns have shown more variance year-to-year but converge toward a fairly stable double-digit range over rolling long periods. Second, FD rates have actually been less stable as a long-term planning anchor than people assume — they've ranged from below 5% during ultra-low-rate years to above 8% during tightening cycles, which means locking a single FD rate today doesn't guarantee anything close to that rate across a multi-decade comparison.
It's worth saying plainly: past performance is not a promise of future returns, for either instrument. Equity markets can and do post multi-year stretches of flat or negative returns, and FD rates can fall meaningfully if the broader rate environment shifts. Treat the historical data as context, not as a guarantee baked into your plan.
Risk vs Reward: The Trade-Off in Plain Terms
Every SIP vs FD decision is really a risk-tolerance decision wearing a returns-comparison costume.
FDs carry almost no market risk. Your principal is protected by the bank's guarantee, and deposits up to ₹5 lakh per bank are additionally insured by DICGC. The trade-off is that this safety comes at the cost of growth — your money is essentially guaranteed not to lose value, but also somewhat guaranteed not to grow much faster than inflation.
SIPs in equity funds carry real, visible market risk. A SIP that's been running for three years can show you a negative return on your screen during a market downturn, and that's not a malfunction — it's the system working as designed. The entire point of staying invested through that volatility is that compounding rewards the investor who doesn't panic-sell at the bottom.
Where this gets misunderstood: investors often treat "risk" as a single dial, when it's really about matching the right risk level to the right time horizon. Money you'll need in 18 months has no business being risk-exposed regardless of expected returns, because a downturn right before you need the cash can permanently impair the goal. Money you won't touch for 15 years can absorb several bad years and still come out ahead, because time is what neutralizes short-term volatility in equity investing.
Different Investor Scenarios: Who Actually Wins With What
The 26-Year-Old First Jobber
Long horizon, low current obligations, high capacity to absorb volatility. A pure equity SIP strategy makes sense here, with FDs reserved only for the emergency fund. Time is this investor's biggest asset, and a step-up SIP that grows with salary increases can meaningfully outpace a flat contribution over a 30+ year career.
The 40-Year-Old With Two Kids' Education to Fund in 8 Years
Medium horizon, specific goal, lower tolerance for a bad timing surprise. This is a genuine "both" scenario — a SIP in a more conservative hybrid fund for part of the goal, with FDs or debt instruments covering the portion needed in the final 2-3 years before the money is actually required, when market risk has the least time to recover from a downturn.
The 58-Year-Old Five Years From Retirement
Short remaining horizon for new contributions, high sensitivity to a market crash right before retirement (sequence-of-returns risk). FDs and conservative debt instruments should dominate new allocations here, even though the return is lower — capital preservation matters more than growth when there's limited time left to recover from a bad year.
The Self-Employed Professional With Irregular Income
Flexibility matters more than optimization. SIPs can be paused without penalty during lean months, which FDs structurally can't accommodate once locked in. A SIP-heavy approach with a healthy liquid emergency buffer tends to work better than committing to fixed monthly FD/RD obligations that don't flex with income swings.
Retirement Planning: Which Wins Over a 25-Year Horizon?
Table 13: Retirement Planning Example — ₹15,000/Month, Age 35 to 60 (25 Years)
| Instrument | Nominal Corpus | Real Value (6% Inflation) | Net of Tax (approx.) |
|---|---|---|---|
| SIP @ 12% | ₹2,84,64,526 | ₹66,32,196 | ~₹2,49,00,000* |
| FD @ 7% (30% slab) | ₹1,22,21,957 | ₹28,47,699 | ~₹95,70,000* |
*Approximate, after applying LTCG/slab tax treatment to total gains.
For retirement specifically, SIP's edge compounds across three separate advantages stacked on top of each other: a higher headline return, more favorable tax treatment on long-term gains, and (critically) a multi-decade horizon long enough to ride out several market cycles before the money is needed. The same FD-heavy strategy that makes sense for a 58-year-old becomes a meaningfully worse choice for a 35-year-old with 25 years of runway, simply because the runway changes what risk actually costs you.
Capital Protection: Where FD Still Wins, No Argument
There's no honest version of this article that pretends SIP wins everywhere. For genuine capital protection — money you cannot afford to see shrink, even temporarily — FD remains the better instrument, full stop.
Table 14: Emergency Fund Example — ₹5,000/Month for 2 Years
| Scenario | Outcome |
|---|---|
| FD/RD @ 6.5% | ₹1,28,473 (guaranteed) |
| SIP in a strong market (+12%) | ₹1,36,216 |
| SIP in a weak market (-10%) | ₹1,08,263 |
This table tells the real story on short horizons. In a good market, the SIP wins by a modest margin. In a bad market — and two-year windows can absolutely include a bad market — the SIP can come in nearly ₹20,000 below what you put in, while the FD guarantees a known, positive return regardless of what markets do. For money with a short, non-negotiable timeline, that asymmetry is the whole argument. Emergency funds, near-term down payments, and money earmarked for a wedding or planned medical expense within 2-3 years belong in FDs or equivalent low-volatility instruments, not equity SIPs.
Best Choice by Investor Type and Decision Matrix
Table 15: Best Choice by Investor Type
| Investor Type | Recommended Primary Instrument | Reasoning |
|---|---|---|
| Young professional (25-35), long horizon | SIP (equity-heavy) | Time absorbs volatility; tax treatment favors long holds |
| Mid-career (35-50), mixed goals | Both — SIP for long goals, FD for near-term | Different goals need different risk profiles |
| Near-retirement (55+) | FD-heavy, SIP only for goals 10+ years out | Limited time to recover from a downturn |
| Risk-averse by temperament | FD-heavy with small SIP exposure | Behavioral fit matters as much as math |
| High earner in 30% tax slab | SIP favored further | FD's slab taxation hurts more at higher income |
| Self-employed, variable income | SIP (flexible, pausable) | FD's fixed obligation doesn't suit income swings |
Table 16: Decision Matrix — Match Your Goal to the Right Instrument
| Your Goal | Time Horizon | Better Fit |
|---|---|---|
| Emergency fund | 0-1 years | FD |
| Wedding/planned expense | 1-3 years | FD or conservative debt fund |
| Car purchase | 2-4 years | FD, or hybrid SIP if 4+ years |
| House down payment | 5-7 years | Mostly SIP, shifting to FD in final 1-2 years |
| Child's education | 10-15 years | SIP-heavy, rebalancing toward debt as the goal nears |
| Retirement | 15+ years | SIP-heavy, with FD allocation increasing closer to retirement |
| Capital preservation (no growth need) | Any horizon | FD |
Common Mistakes Investors Make in This Decision
Comparing a lump-sum FD quote against a monthly SIP illustration. As covered earlier, this isn't an apples-to-apples comparison and it skews the numbers in FD's favor without anyone realizing it.
Treating 12% as a guaranteed SIP return. It's a historical average, not a promise. Some years deliver 25%+, others deliver negative returns. Planning around the average without stress-testing a lower scenario sets up disappointment.
Putting near-term money into equity SIPs because the long-term return looks better on paper. The emergency fund table above shows exactly why this backfires — a bad two-year stretch can leave you with less than you put in, right when you need the money most.
Letting an FD auto-renew for years without checking the rate. FD rates move with the broader rate cycle. An FD opened during a high-rate window and auto-renewed without review can quietly roll into a meaningfully lower rate.
Ignoring the tax gap entirely. As Table 11 shows, the after-tax difference between SIP and FD outcomes can be larger than many people expect, especially for higher-income investors in the 30% slab.
Who Should Choose SIP?
Choose SIP-led investing if your horizon runs 7+ years, your goal is wealth creation rather than capital preservation, you're comfortable seeing temporary negative returns without panic-selling, and you're in a higher tax bracket where FD's slab taxation eats more into your gains. Long-term retirement savings, wealth-building goals, and any objective more than a decade away are SIP's natural territory.
Who Should Choose FD?
Choose FD-led saving if your horizon is under 3 years, the money has a specific, non-negotiable purpose (emergency fund, a planned expense, a near-term obligation), or you simply cannot tolerate seeing your balance dip even temporarily. FDs are also the right call for any investor whose primary objective is protecting what they already have rather than growing it aggressively.
When Does It Make Sense to Use Both Together?
For almost every investor with multiple financial goals running on different timelines, the honest answer isn't SIP or FD — it's both, deliberately allocated by purpose rather than habit. An emergency fund and near-term goals sit in FDs. Long-term wealth creation runs through SIPs. As goals get closer, money gradually shifts from the SIP side to the FD side, reducing exposure to a bad-timing market event right when the money is about to be needed.
This isn't indecision — it's goal-based allocation, and it's how most working financial plans are actually built. A useful starting exercise is running your full goal list through an investment calculator, mapping each goal to its horizon, and letting the horizon — not a general preference for "growth" or "safety" — decide which instrument it belongs in.
Frequently Asked Questions
Is SIP safer than FD? No. FD is structurally safer because returns are fixed and principal is protected by the bank and DICGC insurance up to ₹5 lakh. SIP carries market risk and can show temporary losses, especially over short periods, even though it has historically delivered higher returns over long horizons.
Can SIP give guaranteed returns? No. SIP returns are market-linked and fluctuate based on the performance of the underlying mutual fund. No mutual fund — equity, debt, or hybrid — can legally promise a guaranteed return, and SEBI requires this disclaimer on all fund communications.
Can SIP beat inflation? Historically, yes, particularly over horizons of 10+ years, where equity mutual fund returns have generally outpaced India's average inflation rate by a meaningful margin. FD returns, by contrast, have often only matched or marginally exceeded inflation, and in some periods have lagged behind it.
Which is better for retirement, SIP or FD? For investors with 15+ years until retirement, SIP is generally the stronger wealth-building tool due to higher historical returns, more favorable long-term tax treatment, and enough time to absorb market cycles. As retirement approaches (typically the final 5-7 years), shifting a growing portion of the corpus into FDs or other low-volatility instruments helps protect against a poorly timed downturn.
Should beginners choose SIP or FD? Beginners with a long time horizon and the temperament to stay invested through market swings can start with SIPs, even in small amounts, to build the habit early. Beginners who are more risk-averse, or who are saving for a near-term goal, may feel more comfortable starting with FDs and gradually adding SIP exposure as their understanding and comfort with market risk grows.
Can SIP make you richer than FD? Over long horizons, the historical data strongly suggests yes — as shown across the comparison tables in this article, a 12% SIP return consistently outpaces a 7% FD return by a widening margin as the time horizon extends, even before accounting for SIP's more favorable tax treatment on long-term gains.
Key Takeaways
- SIP and FD aren't substitutes for each other — they solve different problems, and the "better" choice depends entirely on your time horizon and what the money is for.
- Comparing a monthly SIP to a lump-sum FD is the most common mistake in this debate; the fair comparison is SIP versus a Recurring Deposit, both built on monthly contributions.
- Over 10+ year horizons, SIP has historically outperformed FD by a widening margin, and that gap grows even larger once tax treatment is factored in.
- FD remains the right choice for money with a short, non-negotiable timeline — emergency funds, near-term goals, and any objective where temporary loss isn't an option.
- The 12% SIP return commonly used in illustrations is a historical average, not a guarantee — plan around a realistic range, not a single optimistic number.
- Most working financial plans use both instruments together, allocated by goal and horizon rather than a blanket preference for one over the other.
- Tax treatment is not a footnote — it materially changes which instrument actually leaves you with more money, especially for investors in higher income tax brackets.
A Practical Recommendation
If you're building a financial plan from scratch, don't start by picking SIP or FD. Start by listing your actual goals and their timelines. Anything under 3 years belongs in FD. Anything over 7 years, where you can tolerate volatility, belongs in SIP. The 3-7 year middle ground is where judgment calls happen, usually favoring a blend that shifts toward FD as the goal date approaches. Run your specific numbers — your amount, your timeline, your expected rate — through Numrexo's SIP Calculator and FD Calculator side by side before committing either way, and let your own goals decide rather than a general rule of thumb.
Get new calculators & guides by email
Occasional updates when we add a new calculator or publish a useful guide. No spam, unsubscribe anytime.
By subscribing you agree to our Privacy Policy.