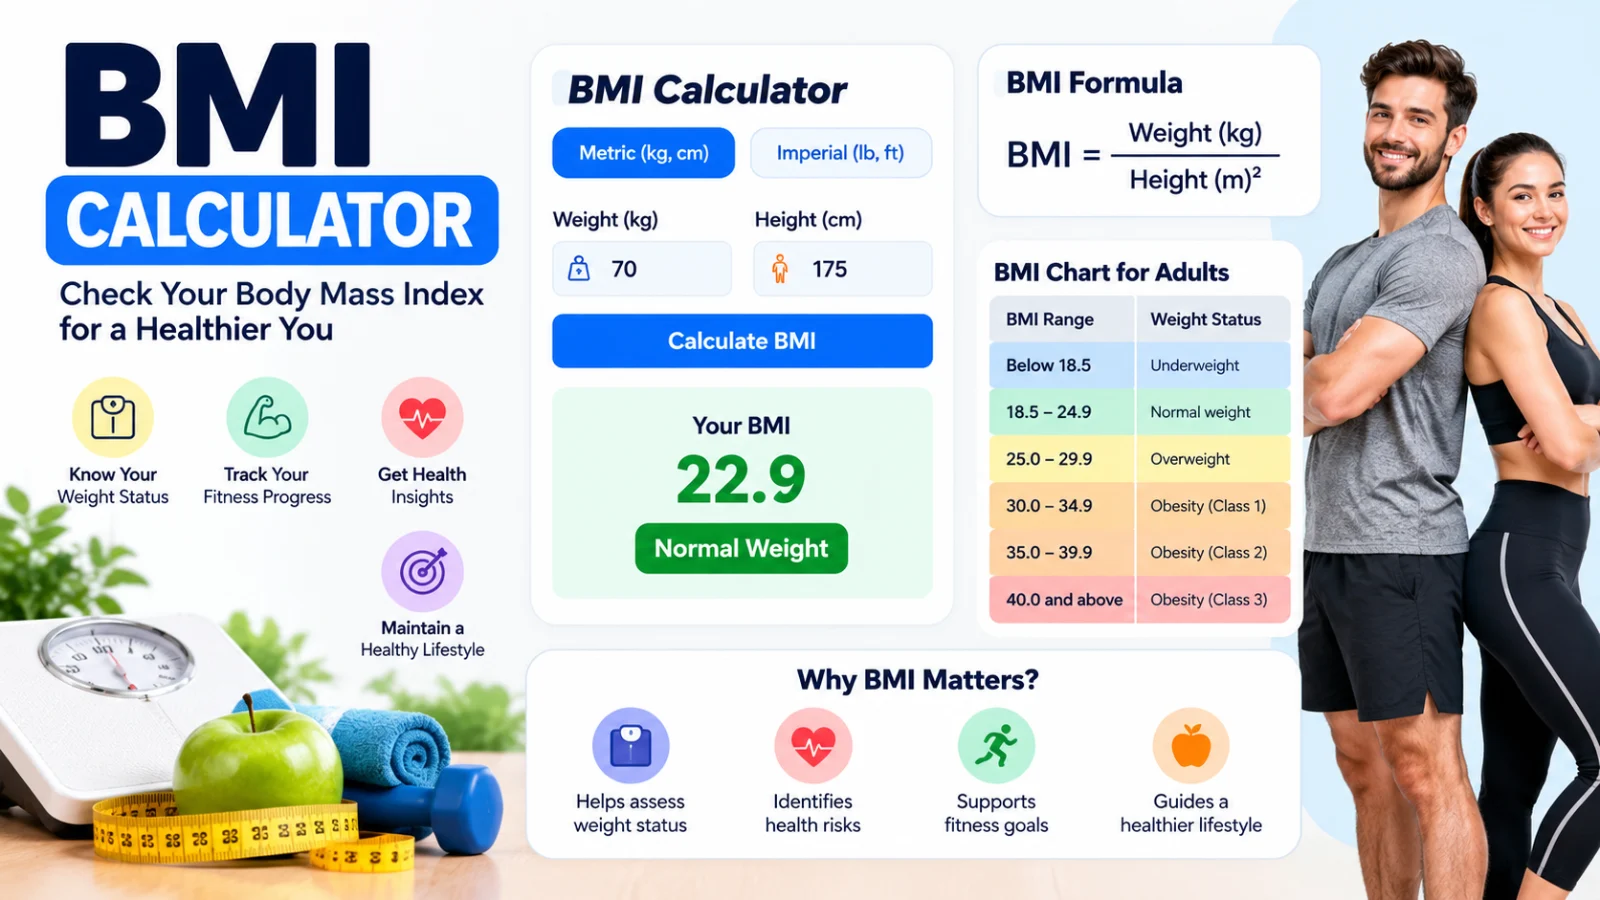
What Is a Healthy BMI for Men and Women? Complete BMI Chart Guide (2026)
Sanjay Singh
Published on 22 Jun 2026 • Updated on 5 Oct 2026
Introduction: Your Weight Number Doesn't Tell the Whole Story — But This One Gets Close
Picture two people walking into the same doctor's office. Both are 5 feet 10 inches tall and weigh 195 pounds. One is a recreational marathon runner with visible muscle definition and a resting heart rate of 54. The other hasn't exercised in three years and is pre-diabetic. According to their body mass index, both score a 28.0 — technically "overweight."
This is the paradox of BMI, and it's exactly why so many people misunderstand it.
Here's the truth: BMI isn't a perfect health measurement — no single number is. But it remains one of the most widely used, research-backed, and practically accessible screening tools in modern medicine. Doctors, the CDC, the NIH, the American Heart Association, and the World Health Organization all use it. And when interpreted correctly — alongside other indicators — it absolutely matters.
So what is a healthy BMI, really? What do the categories actually mean for your heart, your metabolism, and your longevity? And where do you land on the chart?
This guide answers all of that. Whether you're trying to lose weight, understand a recent health screening, or simply want an evidence-based look at your body composition, you've come to the right place.
Key Takeaways
| Topic | Key Facts |
|---|---|
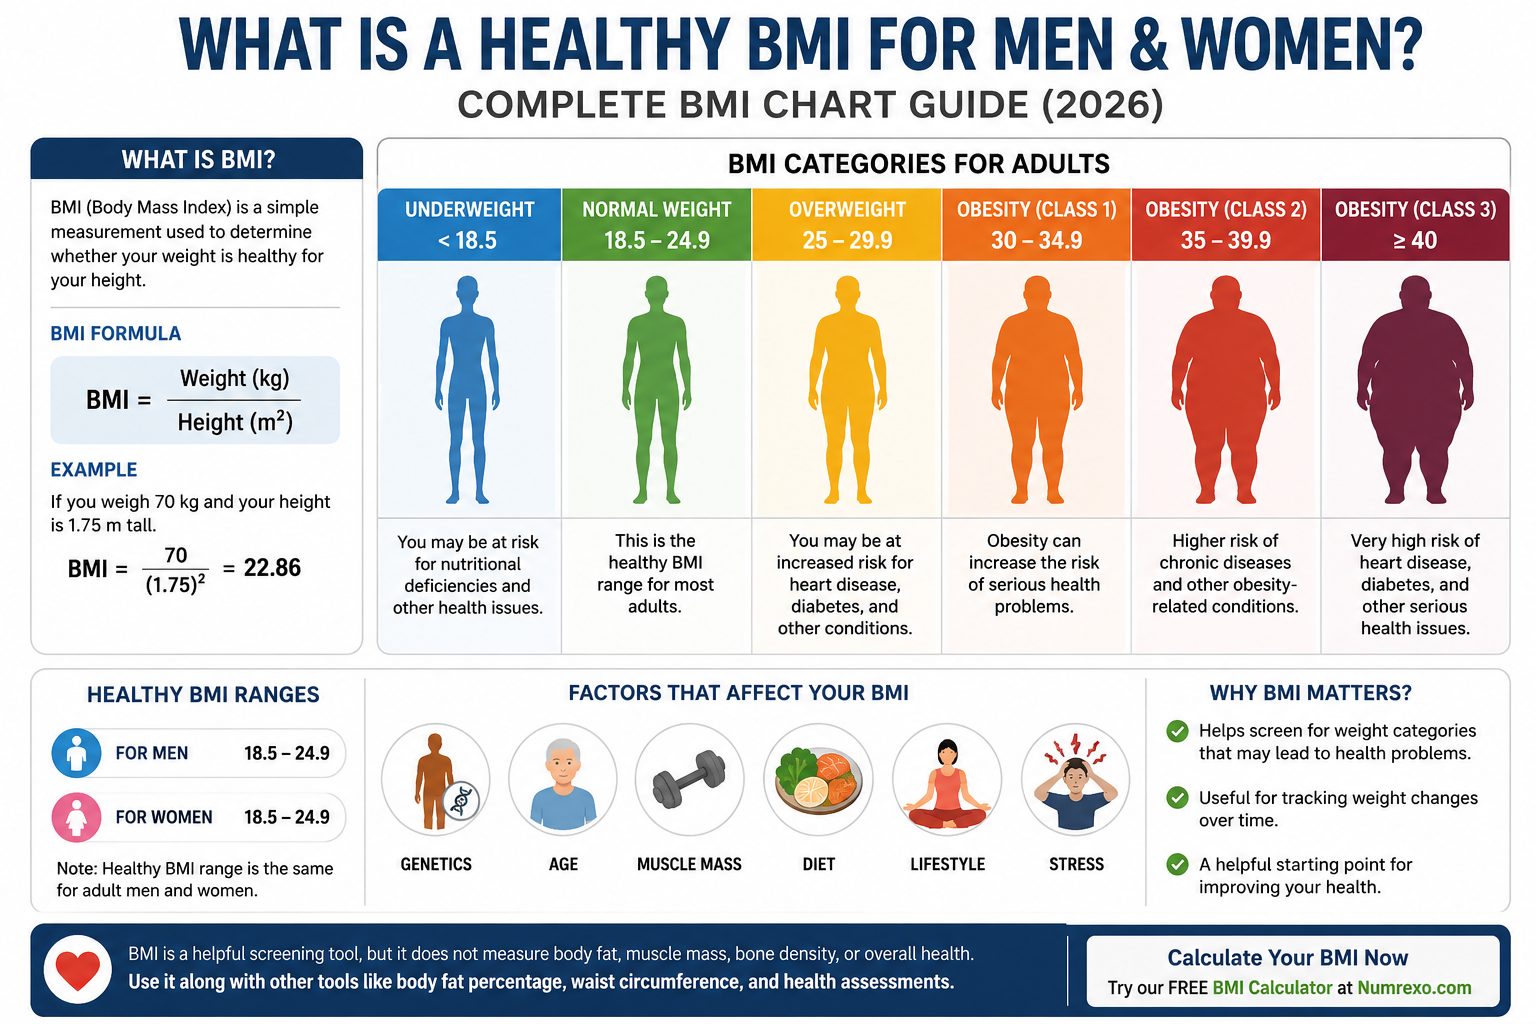
| Healthy BMI Range | 18.5 – 24.9 for all adults (WHO/CDC/NIH standard) |
| Underweight | BMI below 18.5 |
| Overweight | BMI 25.0 – 29.9 |
| Obese (Class I) | BMI 30.0 – 34.9 |
| Obese (Class II) | BMI 35.0 – 39.9 |
| Obese (Class III) | BMI 40.0 and above |
| Average American Man | 5'9", 199.8 lbs, BMI ~29.5 (overweight) |
| Average American Woman | 5'4", 170.8 lbs, BMI ~29.3 (overweight) |
| BMI Formula (Imperial) | (Weight in lbs ÷ Height in inches²) × 703 |
| BMI Limitation | Does not distinguish between fat and muscle |
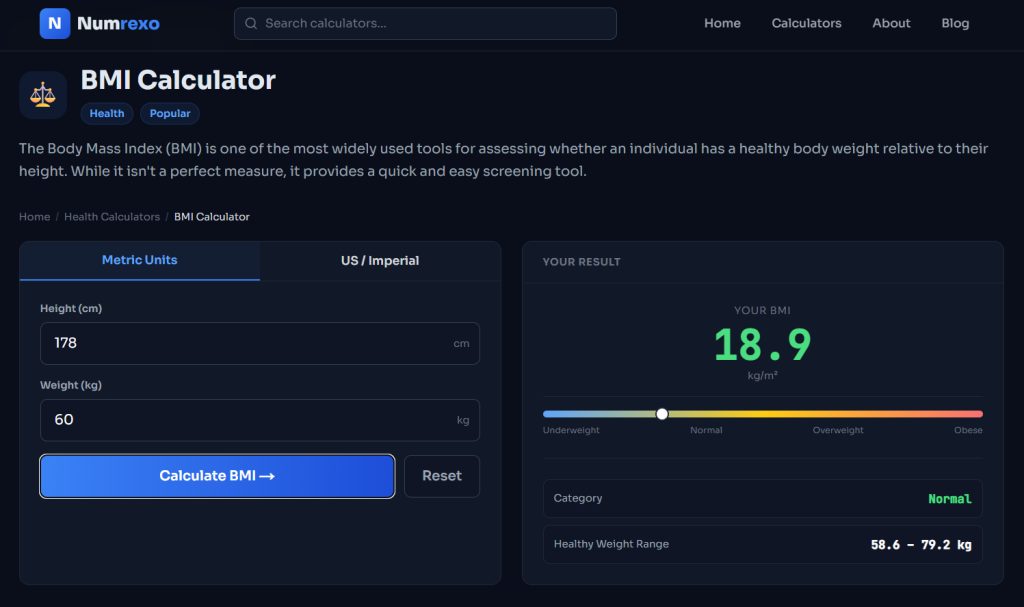
Quick Check: Before reading further, use Numrexo's BMI Calculator to find your number in under 30 seconds. Then come back — this guide will tell you exactly what it means.
What Is BMI?
Body Mass Index (BMI) is a numerical value derived from a person's weight and height. It was developed in the early 19th century by Belgian mathematician Adolphe Quetelet — which is why it was originally called the "Quetelet Index" — but it wasn't widely adopted in clinical medicine until the 1970s when physiologist Ancel Keys formally proposed it as a population-level screening tool.
Today, BMI is defined simply as:
Weight (kg) ÷ Height (m²)
Or in American units:
[Weight (lbs) ÷ Height (inches²)] × 703
The result is a single number that places you into one of four primary categories: underweight, normal weight, overweight, or obese.
It's not a direct measure of body fat — that requires DEXA scans, hydrostatic weighing, or other specialized techniques. What BMI does is estimate whether your weight-to-height ratio falls within a range historically associated with lower disease risk. That makes it a useful first-pass screening tool, even with its well-documented limitations.
Think of BMI like a smoke detector. It doesn't tell you exactly where the fire is or how bad it is — but it tells you something might be wrong and prompts you to investigate further.
Why BMI Matters: The Health Consequences Are Real
Some people dismiss BMI as an outdated or oversimplified metric. And while the criticisms have merit (more on those later), the underlying health data behind BMI categories is extensive and consistent.
Research consistently shows that BMIs outside the healthy range — both too high and too low — are associated with significantly elevated risk of serious health conditions:
Higher BMI (Overweight/Obese) is associated with:
- Type 2 diabetes
- Cardiovascular disease and stroke
- High blood pressure (hypertension)
- Sleep apnea
- Osteoarthritis
- Non-alcoholic fatty liver disease
- Certain cancers (breast, colon, kidney, esophageal, and others)
- Mental health conditions including depression
Lower BMI (Underweight) is associated with:
- Nutrient deficiencies and malnutrition
- Anemia
- Osteoporosis and increased fracture risk
- Compromised immune function
- Fertility issues
- Increased surgical complication risk
According to the American Heart Association, obesity is a major, independent risk factor for heart disease — the leading cause of death in the United States. And the Centers for Disease Control and Prevention estimates that obesity-related conditions cost the U.S. healthcare system approximately $173 billion per year.
This is not about aesthetics. It's about lifespan, quality of life, and healthcare costs that affect all of us.
The BMI Formula Explained
Imperial (U.S.) Formula
Most Americans think in pounds and feet, so let's start there.
BMI = (Weight in pounds ÷ Height in inches²) × 703
Example: A woman who weighs 145 pounds and stands 5 feet 5 inches tall (65 inches):
- 145 ÷ (65 × 65) = 145 ÷ 4,225 = 0.0343
- 0.0343 × 703 = 24.1
Her BMI is 24.1 — solidly in the "Normal Weight" category.
Metric Formula
BMI = Weight in kg ÷ Height in meters²
Example: A man who weighs 88 kg and stands 1.80 meters tall:
- 88 ÷ (1.80 × 1.80) = 88 ÷ 3.24 = 27.2
His BMI is 27.2 — in the "Overweight" category.
Doing the math manually is doable, but it's easy to make errors — especially when converting units. The most reliable approach is to use a dedicated calculator. Numrexo's BMI Calculator handles all the unit conversions automatically and gives you your category instantly.
Complete BMI Chart for Adults (2026)
The following reference chart covers adults aged 20 and older. To use it: find your height in the left column, then locate the weight column closest to yours. The number at the intersection is your BMI.
BMI Chart: Heights 5'0" to 6'4" (Imperial)
| Height | Underweight (<18.5) | Normal Weight (18.5–24.9) | Overweight (25–29.9) | Obese (30+) |
|---|---|---|---|---|
| 5'0" (60") | Below 95 lbs | 95–127 lbs | 128–153 lbs | 154+ lbs |
| 5'1" (61") | Below 100 lbs | 100–132 lbs | 133–158 lbs | 159+ lbs |
| 5'2" (62") | Below 104 lbs | 104–136 lbs | 137–163 lbs | 164+ lbs |
| 5'3" (63") | Below 107 lbs | 107–140 lbs | 141–168 lbs | 169+ lbs |
| 5'4" (64") | Below 110 lbs | 110–144 lbs | 145–174 lbs | 175+ lbs |
| 5'5" (65") | Below 114 lbs | 114–149 lbs | 150–179 lbs | 180+ lbs |
| 5'6" (66") | Below 118 lbs | 118–154 lbs | 155–185 lbs | 186+ lbs |
| 5'7" (67") | Below 121 lbs | 121–158 lbs | 159–190 lbs | 191+ lbs |
| 5'8" (68") | Below 125 lbs | 125–163 lbs | 164–196 lbs | 197+ lbs |
| 5'9" (69") | Below 128 lbs | 128–168 lbs | 169–202 lbs | 203+ lbs |
| 5'10" (70") | Below 132 lbs | 132–173 lbs | 174–208 lbs | 209+ lbs |
| 5'11" (71") | Below 136 lbs | 136–178 lbs | 179–214 lbs | 215+ lbs |
| 6'0" (72") | Below 140 lbs | 140–183 lbs | 184–220 lbs | 221+ lbs |
| 6'1" (73") | Below 144 lbs | 144–188 lbs | 189–226 lbs | 227+ lbs |
| 6'2" (74") | Below 148 lbs | 148–193 lbs | 194–232 lbs | 233+ lbs |
| 6'3" (75") | Below 152 lbs | 152–198 lbs | 199–238 lbs | 239+ lbs |
| 6'4" (76") | Below 156 lbs | 156–204 lbs | 205–245 lbs | 246+ lbs |
Weights are approximated to the nearest pound. Use Numrexo's BMI Calculator for a precise calculation.
Healthy BMI Range for Men
The official healthy BMI range for adult men is 18.5 to 24.9, identical to the range used for women. This is the standard established by the WHO, the CDC, and the National Institutes of Health.
However, there's important nuance here.
Because men typically carry 30–35% more muscle mass than women of the same height, a man with a BMI of 26 or 27 may have significantly less body fat than a woman with the same BMI. Muscle is denser than fat — it takes up less space but weighs more. A muscular man can easily tip into "overweight" territory on the BMI scale while maintaining a perfectly healthy body fat percentage of 12–18%.
Some sports medicine and endocrinology researchers argue that an optimal BMI target for men is closer to 20–25, recognizing that the upper end of the standard healthy range (around 23–24.9) is where men tend to carry the lowest chronic disease risk.
Practical Reference for Men
| Height | Healthy Weight Range (BMI 18.5–24.9) |
|---|---|
| 5'6" | 115–154 lbs |
| 5'8" | 122–164 lbs |
| 5'9" | 125–168 lbs |
| 5'10" | 129–173 lbs |
| 5'11" | 133–178 lbs |
| 6'0" | 136–183 lbs |
| 6'1" | 140–188 lbs |
| 6'2" | 144–194 lbs |
The average American man is 5 feet 9 inches tall, weighs approximately 199.8 pounds, and has a BMI of roughly 29.5 — putting him in the overweight category. That's a meaningful data point. It suggests the average American man is carrying weight that elevates his chronic disease risk, particularly for cardiovascular disease and type 2 diabetes.
Additionally, men are more prone to android fat distribution — storing excess fat around the abdomen. This visceral fat surrounds internal organs and is metabolically active, producing inflammatory compounds that directly increase cardiovascular risk. Men should also monitor their waist circumference: a measurement above 40 inches is a clinical red flag regardless of BMI.
Healthy BMI Range for Women
The standard healthy BMI range for women is also 18.5 to 24.9, but women's bodies respond to this number differently than men's.
At the same BMI, women naturally carry 6–11% more body fat than men. This is biologically normal — women require higher essential fat for reproductive function, hormonal balance, and metabolic health. A woman with a BMI of 22 might have a body fat percentage of 25–30%, while a man with the same BMI might be at 15–20%. Both can be perfectly healthy.
Epidemiological research suggests that women tend to have their lowest cardiovascular and type 2 diabetes risk when their BMI falls in the 21–22 range, though the full 18.5–24.9 band is considered clinically healthy.
Critical caveat for women: Chasing an extremely low BMI is not healthy. A BMI below 18.5 in women is associated with amenorrhea (loss of menstrual cycle), reduced bone density, hormonal disruption, and fertility issues. This is a real danger, especially given cultural pressures around body image.
Practical Reference for Women
| Height | Healthy Weight Range (BMI 18.5–24.9) |
|---|---|
| 5'0" | 95–127 lbs |
| 5'2" | 101–135 lbs |
| 5'4" | 108–144 lbs |
| 5'5" | 111–149 lbs |
| 5'6" | 115–154 lbs |
| 5'7" | 118–159 lbs |
| 5'8" | 122–163 lbs |
| 5'10" | 129–173 lbs |
The average American woman is 5 feet 4 inches tall, weighs approximately 170.8 pounds, and has a BMI of roughly 29.3 — also in the overweight category.
Women's BMI also shifts meaningfully with hormonal changes. Menopause, in particular, is associated with increased fat redistribution from the hips and thighs (gynoid pattern) to the abdomen — changing both body composition and health risk even if BMI remains static. Waist circumference becomes increasingly important for women post-menopause; a waist above 35 inches signals elevated cardiometabolic risk.
BMI Categories Explained in Full
The four major BMI categories recognized by the CDC and WHO are:
Underweight: BMI Below 18.5
Being underweight is often overlooked in health conversations that focus on obesity, but it carries serious risks. Underweight individuals are at higher risk for nutrient deficiencies, anemia, immune impairment, and bone fractures. In older adults, low BMI is strongly associated with sarcopenia (muscle loss) and falls.
Underweight status can stem from inadequate food intake, eating disorders, hyperthyroidism, cancer, chronic illness, or malabsorption conditions. It requires medical evaluation — not just increased caloric intake.
Normal/Healthy Weight: BMI 18.5–24.9
This range is associated with the lowest all-cause mortality risk across large population studies. People in this range have statistically lower rates of heart disease, stroke, type 2 diabetes, and many cancers compared to those in higher or lower BMI categories.
That said, "normal BMI" does not guarantee good health. Research published in Mayo Clinic Proceedings found that up to 30% of people with a normal BMI may have excess body fat — a condition sometimes called "normal weight obesity" or being "skinny fat." This is why BMI alone should never be the final word.
Overweight: BMI 25.0–29.9
Being overweight represents a moderate increase in health risk. The risk isn't uniform within this range — someone with a BMI of 25.1 faces different odds than someone at 29.8. Research suggests that the lower end of overweight (25–27) may carry minimal added risk for some individuals, particularly those with high muscle mass or favorable metabolic markers.
However, BMI in the high overweight range (28–29.9), combined with a large waist circumference or elevated fasting glucose, signals meaningful metabolic risk that warrants lifestyle intervention.
Obese: BMI 30.0 and Above
Obesity is further subdivided into three classes:
| Class | BMI Range | Risk Level |
|---|---|---|
| Class I (Moderate Obesity) | 30.0 – 34.9 | High |
| Class II (Severe Obesity) | 35.0 – 39.9 | Very High |
| Class III (Extreme/Morbid Obesity) | 40.0 and above | Extremely High |
Each step up in obesity class corresponds to significantly elevated risk for cardiovascular events, type 2 diabetes complications, sleep apnea severity, mobility limitations, and premature mortality. The good news: even modest weight loss of 5–10% of body weight can produce clinically meaningful health improvements.
How BMI Changes With Age
BMI is a static formula — it doesn't automatically adjust for the natural changes in body composition that occur across the lifespan. This is one of its more clinically significant limitations.
In your 20s and 30s: BMI most accurately reflects body fat in this age group. Muscle mass is typically at its peak, and the relationship between BMI and adiposity is relatively reliable.
In your 40s and 50s: Body composition begins shifting. Even without weight gain, adults typically lose 3–8% of muscle mass per decade starting in their 30s — a process called sarcopenia. This means fat mass can increase while the scale (and BMI) remain unchanged. A 50-year-old at a BMI of 24 may have significantly more body fat than a 25-year-old at the same BMI.
In your 60s and beyond: For older adults, some research suggests that slightly higher BMIs (in the 25–27 range) may actually be protective, associated with lower all-cause mortality compared to BMIs at the lower end of the normal range. This counterintuitive phenomenon — sometimes called the "obesity paradox" — is still debated, but it underscores that BMI cutoffs are not universally optimal across all age groups.
For youth (under 20): BMI is calculated the same way, but interpreted differently. Children and teens are evaluated using age- and sex-specific percentile charts because body composition changes significantly through puberty. A BMI-for-age percentile at or above the 95th percentile indicates obesity; 85th to 94th percentile indicates overweight.
BMI Limitations Most People Don't Know
Here's where we need to be honest. BMI is valuable, but it has well-documented blind spots that every informed adult should understand.
1. It Doesn't Measure Body Fat Directly
BMI measures weight relative to height — nothing more. It cannot distinguish between a pound of fat and a pound of muscle, and it says nothing about where fat is distributed in your body. Visceral fat (around your organs) is far more metabolically dangerous than subcutaneous fat (under your skin), and BMI doesn't capture this distinction.
2. It Overestimates Risk for Muscular Individuals
An experienced weightlifter or football lineman can have a BMI well into the "overweight" or even "obese" range while carrying very low body fat. This doesn't mean BMI is wrong — it means BMI was designed for population-level screening, not individual diagnosis.
3. It Underestimates Risk for Some Racial and Ethnic Groups
WHO guidelines and independent research indicate that South Asian, East Asian, and some other Asian-origin populations face elevated metabolic risk at lower BMI levels than the standard cutoffs suggest. For these groups, a BMI of 23.0 may represent the same metabolic risk that a BMI of 25.0 does for someone of European origin. Several public health organizations now recommend ethnicity-adjusted BMI thresholds.
4. It Misses the Waist Circumference Picture
Two people can have identical BMIs with radically different health risks depending on where they carry their weight. Central adiposity — fat around the midsection — is more closely linked to cardiovascular and metabolic disease than peripheral fat. Waist circumference (and the waist-to-hip ratio) adds crucial information that BMI alone misses.
5. It Doesn't Account for Age-Related Changes
As discussed in the previous section, muscle loss with aging means the same BMI at 60 represents a different body composition than at 30.
6. It Has Historical Bias
The BMI reference data was largely derived from studies of white European males in the mid-20th century. Its applicability across all racial, ethnic, and gender groups has been questioned by researchers, and this is an active area of scientific inquiry.
The takeaway: Use BMI as what it is — a starting point, not a verdict. For a more complete picture of your body composition, consider pairing your BMI with results from Numrexo's Body Fat Calculator, which estimates your fat percentage based on additional measurements.
Why Athletes Often Have Misleading BMI Scores
Let's settle this one definitively, because it causes a lot of confusion.
A 6'1" linebacker who weighs 240 pounds has a BMI of 31.6 — technically "obese." A professional marathon runner who is 5'9" and weighs 150 pounds has a BMI of 22.2 — "normal weight." Both are elite athletes. Both could be in exceptional health. But their BMI numbers are miles apart.
Here's why this happens: muscle tissue is approximately 18% denser than fat tissue. This means a highly trained individual can weigh significantly more per unit of height than a sedentary person while having far less total body fat.
This doesn't mean athletes should ignore BMI entirely. Even elite athletes should monitor their BMI over time — dramatic increases can signal unhealthy weight gain even for someone with a high muscle base. But interpreting an athlete's single BMI reading without context is clinically misleading.
For active individuals, a better approach is to track:
- Body fat percentage (use Numrexo's Body Fat Calculator)
- Waist circumference
- Visceral fat markers (available through DEXA scans)
- Metabolic markers: fasting glucose, insulin, triglycerides, HDL cholesterol
BMI and Chronic Disease Risk: What the Science Says
The relationship between BMI and chronic disease risk is one of the most extensively studied associations in epidemiology. Here's what decades of research tell us:
Cardiovascular Disease
Large meta-analyses consistently show that BMI above 25 is associated with increased cardiovascular risk, with the relationship becoming steeper above 30. The Framingham Heart Study, one of the longest-running cardiovascular cohort studies in history, found that obesity nearly doubled the risk of heart failure over a 14-year period.
Type 2 Diabetes
The connection between BMI and type 2 diabetes is among the strongest in metabolic medicine. Research suggests that for every 1-unit increase in BMI above 22, the risk of type 2 diabetes increases by approximately 12%. BMI values of 30 or higher carry an approximately 7-fold increased risk compared to a BMI of 22.
Cancer
The American Cancer Society identifies overweight and obesity as the second leading preventable cause of cancer in the United States, behind only tobacco use. Being overweight or obese is linked to at least 13 types of cancer, including breast, colon, endometrial, kidney, and esophageal cancers.
Hypertension and Stroke
A BMI above 25 is associated with meaningfully elevated blood pressure. For every 5-unit increase in BMI, systolic blood pressure rises by approximately 4.5 mmHg and diastolic by 3 mmHg — changes that significantly increase stroke risk over time.
Mental Health
The relationship between BMI and mental health runs in both directions. Obesity is associated with higher rates of depression and anxiety, partly due to social stigma and partly due to metabolic effects on brain chemistry. Conversely, depression can drive weight gain through disrupted sleep, reduced activity, and emotional eating. Both directions of this relationship are clinically important.
Common BMI Myths — Debunked
Myth #1: "If my BMI is normal, I'm healthy." Not necessarily. As noted above, up to 30% of people with normal BMI have metabolically unhealthy body compositions. Regular checkups, metabolic bloodwork, and attention to waist circumference matter alongside BMI.
Myth #2: "BMI is different for men and women." The formula and categories are identical for both sexes. What differs is how body composition relates to a given BMI value — women carry more fat at any given BMI, while men tend to carry more muscle. But the numeric cutoffs from WHO, CDC, and NIH are the same.
Myth #3: "A higher BMI is always dangerous for older adults." Some research suggests a BMI in the 25–27 range may be slightly protective for adults over 65, possibly because the reserve weight provides a buffer during illness or recovery. This doesn't mean obesity is beneficial, but it does mean rigid cutoffs shouldn't be applied uniformly across all ages.
Myth #4: "You can tell someone's BMI by looking at them." Body composition is highly individual. Two people of identical height and weight can look dramatically different based on muscle distribution, fat placement, and skeletal frame. BMI is a numeric value — not a visual one.
Myth #5: "Once you're in the obese range, weight loss won't help much." This is false. Research consistently shows that even a 5–10% reduction in body weight for people in the obese BMI range produces significant, measurable improvements in blood pressure, blood sugar, cholesterol, joint stress, and cardiovascular risk. Small improvements matter enormously in medicine.
Myth #6: "BMI was designed for individual health assessment." Actually, BMI was originally designed as a population-level statistical tool. Ancel Keys, who popularized its use in the 1970s, explicitly noted it was inappropriate for diagnosing individuals. This context matters when interpreting personal BMI results.
How To Improve Your BMI Naturally
If your BMI falls outside the healthy range, the path forward is well-established by science — though it's rarely as simple as "eat less, move more." Real-world weight management requires addressing nutrition, physical activity, sleep, stress, and in some cases, underlying metabolic conditions.
1. Understand Your Caloric Baseline
Before changing anything, understand what your body actually needs. Your Basal Metabolic Rate (BMR) — the number of calories your body burns at complete rest — is the foundation of any weight management strategy. Use Numrexo's BMR Calculator to determine your baseline, then factor in your activity level to get your Total Daily Energy Expenditure (TDEE). From there, a modest caloric deficit or surplus (depending on your goal) becomes much more strategic.
2. Prioritize Protein
Adequate dietary protein supports muscle preservation during weight loss and increases satiety between meals. Most research suggests 0.7–1.0 grams of protein per pound of body weight for active adults trying to lose fat while maintaining muscle. Lean meats, eggs, legumes, dairy, and protein supplements all contribute.
3. Resistance Training
Muscle tissue increases your resting metabolic rate — meaning you burn more calories around the clock. For people trying to lower their BMI, adding resistance training (2–4 sessions per week) helps preserve muscle while losing fat, which can actually result in a leaner, healthier body composition even before the scale moves dramatically.
4. Cardiovascular Exercise
The American Heart Association recommends at least 150 minutes of moderate-intensity aerobic activity per week, or 75 minutes of vigorous activity, for cardiovascular health. This level of activity also supports a healthy BMI over time. Brisk walking, cycling, swimming, or using an elliptical are all effective.
5. Sleep Quality
This one surprises many people. Chronic sleep deprivation (less than 7 hours per night) disrupts ghrelin and leptin — the hormones that regulate hunger and fullness — making it biologically harder to maintain a healthy weight. A 2022 study from the University of Chicago found that increasing sleep from 6.5 to 8.5 hours per night led to an average spontaneous reduction of 270 calories per day.
6. Track Your Intake (At Least Temporarily)
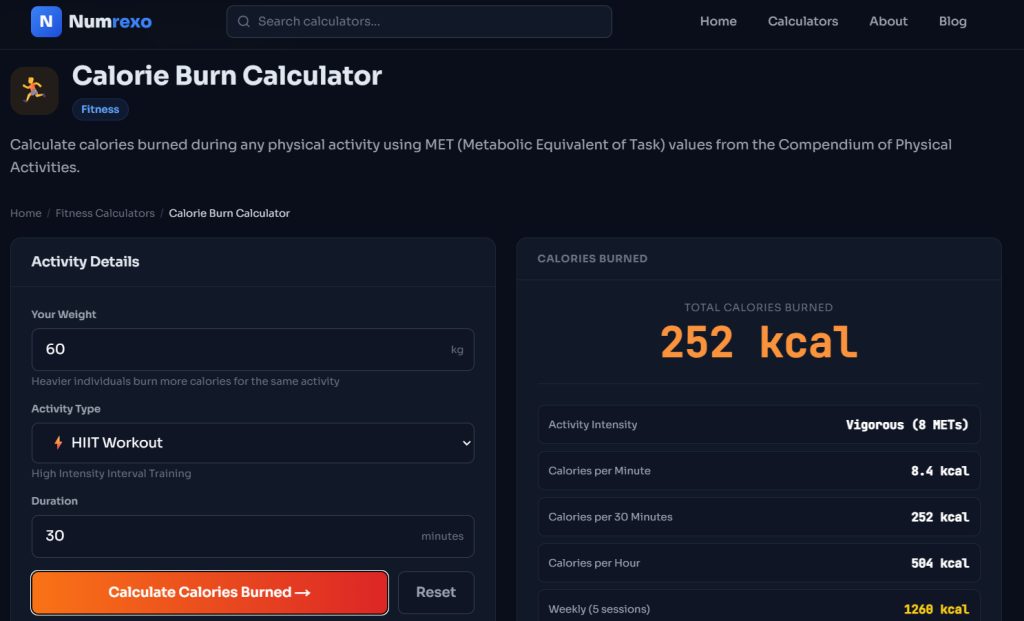
Research suggests that people dramatically underestimate calorie intake when not tracking. Even a few weeks of logging what you eat — using apps like MyFitnessPal or Cronometer — builds awareness that persists long after you stop. Use Numrexo's Calorie Calculator to determine appropriate daily calorie targets based on your goals.
7. Set Goal-Based Targets
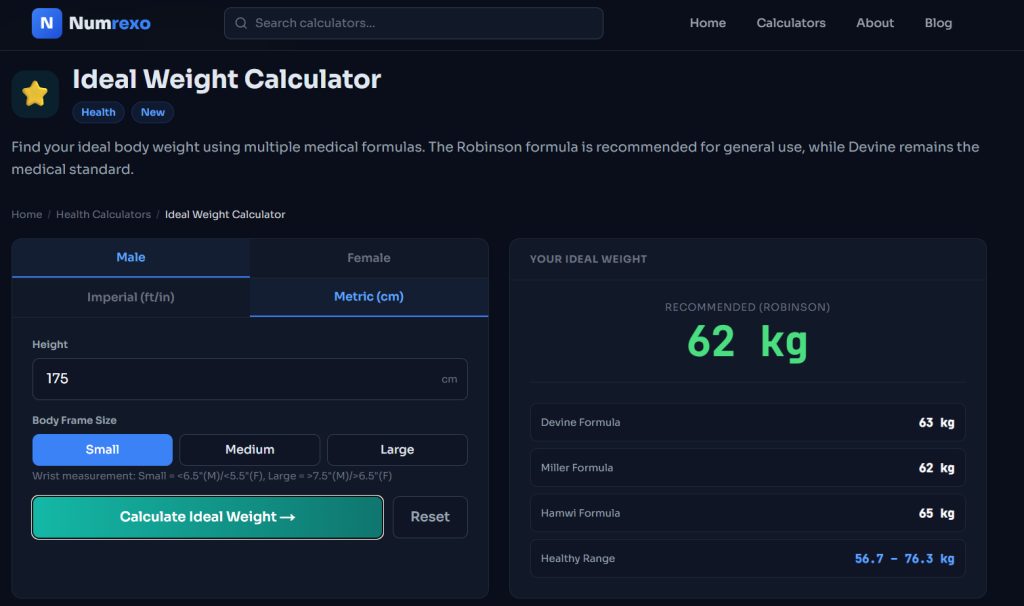
Rather than trying to fix everything at once, set specific, measurable weight targets. Numrexo's Weight Loss Calculator can help you project how long it will take to reach a goal BMI based on your current stats and planned caloric deficit — which makes the process feel concrete and achievable.
8. Address Stress and Emotional Eating
Chronic stress elevates cortisol, which promotes fat storage — particularly visceral fat. Behavioral approaches including mindfulness, cognitive-behavioral therapy (CBT) techniques, journaling, and structured meal timing have all demonstrated effectiveness in reducing stress-driven weight gain. This is an underappreciated dimension of weight management.
Practical Real-Life Examples
Example 1: Sarah, 34, Teacher from Ohio
Sarah is 5'4" and weighs 158 pounds. Her BMI is 27.1 — overweight. She doesn't feel unhealthy, exercises 2–3 times per week, and her cholesterol and blood pressure are fine.
Sarah's next steps: Add a strength training session, monitor waist circumference (currently 33 inches, below the 35-inch risk threshold for women), and consult her doctor about metabolic bloodwork. Her BMI warrants attention but doesn't indicate crisis. A 5–7 pound weight loss would move her into the healthy range.
Example 2: Marcus, 41, IT Professional from Texas
Marcus is 5'11" and weighs 248 pounds. His BMI is 34.6 — Class I Obesity. He works at a desk, sleeps 5–6 hours per night, and his fasting glucose is borderline at 101 mg/dL.
Marcus needs a multi-pronged intervention: caloric reduction, daily walking, sleep improvement, and a follow-up fasting glucose test in 3 months. Even a 10% weight reduction (about 25 pounds) would meaningfully lower his diabetes and cardiovascular risk. This is exactly the type of situation where BMI as a prompt to action is genuinely life-saving.
Example 3: Jennifer, 28, Competitive Cyclist from Colorado
Jennifer is 5'7" and weighs 163 pounds. Her BMI is 25.5 — technically overweight. She trains 12 hours per week, races competitively, and her body fat percentage is approximately 19%.
Jennifer's BMI is misleading. Her muscle mass from cycling elevates her weight without excess fat. Waist circumference (27 inches), metabolic bloodwork, and performance metrics all indicate excellent health. BMI, in her case, is not a useful standalone measure.
Expert Insights
On BMI's appropriate role in clinical practice:
The American Heart Association recommends BMI as one component of cardiovascular risk assessment — used alongside waist circumference, blood pressure, lipid panels, and fasting glucose rather than in isolation. No credible medical organization recommends relying solely on BMI for individual health decisions.
On waist circumference as a complement:
The NIH's National Heart, Lung, and Blood Institute recommends measuring waist circumference for any adult with a BMI between 25 and 34.9. For men, a waist above 40 inches indicates elevated risk. For women, the threshold is 35 inches. This single additional measurement dramatically improves the clinical value of BMI.
On ethnicity-adjusted thresholds:
A 2023 research review in The Lancet regional findings confirmed that South Asian, East Asian, and Southeast Asian populations face elevated cardiometabolic risk at BMI values below standard Western cutoffs. Some clinicians now use 23.0 as the overweight threshold and 27.5 as the obesity threshold for patients of Asian descent — a clinically meaningful difference.
On the obesity paradox in older adults:
A meta-analysis published in JAMA found that among adults over 65, overweight (BMI 25–29.9) was associated with slightly lower all-cause mortality than normal weight — a counterintuitive finding that has been replicated in multiple cohorts. This doesn't make obesity healthy at any age, but it does suggest that applying identical cutoffs across all life stages is an oversimplification.
Frequently Asked Questions About BMI
Q: What is a healthy BMI for a 40-year-old woman? The standard healthy range of 18.5–24.9 applies at 40. However, given the body composition changes that begin in your late 30s, tracking waist circumference alongside BMI is increasingly important. A 40-year-old woman with a BMI of 24 but a waist above 35 inches should discuss her metabolic health with a doctor.
Q: Is BMI 24.9 considered healthy? Yes. A BMI of 24.9 sits at the upper boundary of the healthy weight range. It's technically within normal limits, though if you're at 24.9 with a sedentary lifestyle, it may be worth paying attention to the direction of travel — small weight gains over time can push you into the overweight range.
Q: Can you have a healthy BMI and still be unhealthy? Yes. This is sometimes called "normal weight metabolic obesity" or being "metabolically obese, normal weight." Blood pressure, blood sugar, cholesterol, and inflammation markers are all better health predictors than BMI alone.
Q: What BMI is considered obese for a man? A BMI of 30.0 or above is the clinical threshold for obesity in men — the same as for women. Men with a BMI in the obese range, particularly with a waist circumference above 40 inches, face substantially elevated cardiovascular and metabolic risk.
Q: Does muscle mass affect BMI? Yes. Because BMI is calculated from total body weight — not fat mass specifically — individuals with high muscle mass can have elevated BMIs that don't reflect excess body fat. This is the most common legitimate criticism of BMI as an individual health metric.
Q: Is BMI 18.5 too thin? A BMI of exactly 18.5 sits at the lower boundary of healthy. While technically not underweight, it leaves no room for error and is close to the range where nutritional deficiencies and hormonal disruption can occur — especially for women.
Q: How often should I check my BMI? For most adults, checking every 3–6 months is sufficient to track meaningful trends. Daily or weekly checks aren't necessary and can cause unnecessary anxiety due to normal weight fluctuations from water retention, food volume, and hormonal cycles.
Q: What is the ideal BMI for weight loss? There's no single "ideal" target BMI for weight loss goals. A more practical approach is to aim for the upper boundary of the healthy range first (BMI 24.9) and then reassess based on how you feel and what your metabolic markers show. Use Numrexo's Weight Loss Calculator to map a realistic timeline to your goal.
Q: Is BMI different for seniors? The formula is the same, but interpretation differs. Some clinical guidelines suggest that for adults over 65, a BMI of 23–28 may represent the healthiest range — accounting for muscle loss and the potential protective role of body reserves during illness.
Q: What's a good BMI for a 5'10" man? For a man who is 5'10" (70 inches), a healthy BMI of 18.5–24.9 corresponds to approximately 129–173 pounds. Most sports medicine physicians would consider 155–170 pounds optimal for a moderately active man of this height.
Conclusion: Your BMI Is a Starting Point, Not a Sentence
BMI is one of the most useful public health tools ever devised — not because it's perfect, but because it's accessible, reproducible, and backed by decades of population-level research linking weight-to-height ratios to real health outcomes. Millions of Americans are at elevated disease risk partly because their BMI sits above the healthy range, and most of them don't know it.
But BMI is a beginning, not an endpoint. It's a prompt to look more closely — at your waist circumference, your metabolic bloodwork, your body fat percentage, your activity levels, your sleep, and your daily habits. Used this way, it becomes genuinely powerful.
So here's what we recommend as your immediate next steps:
Step 1: Use Numrexo's BMI Calculator to find your exact BMI right now. It takes 30 seconds.
Step 2: If your BMI is outside the healthy range, use the BMR Calculator to understand your metabolic baseline and calorie needs.
Step 3: Get a fuller picture of your body composition with the Body Fat Calculator — especially if you're very active or have concerns about the accuracy of your BMI.
Step 4: Build a plan. The Calorie Calculator and Weight Loss Calculator help you set realistic, data-backed targets rather than guessing.
Your weight and health are not your identity. But understanding them clearly — with the right tools and the right context — gives you the information you need to make genuinely meaningful choices. Start with your BMI. See where you stand. Then decide what you want to do about it.
This article is intended for general informational purposes only and does not constitute medical advice. BMI is a screening tool, not a diagnostic measure. Always consult a qualified healthcare provider for personalized health assessment and treatment recommendations.
References:
- Centers for Disease Control and Prevention (CDC). "About Adult BMI." Updated 2024.
- World Health Organization. "BMI Classification." Global Database on Body Mass Index, 2024.
- American Heart Association. "Body Mass Index in Adults." Updated April 2026.
- American Cancer Society. "Body Mass Index (BMI) Calculator." Cancer Prevention & Early Detection Facts & Figures 2025–2026.
- National Heart, Lung, and Blood Institute (NIH). "Calculate Your BMI." 2024.
- Wu Y, Li D, Vermund SH. "Advantages and Limitations of the Body Mass Index (BMI) to Assess Adult Obesity." International Journal of Environmental Research and Public Health. 2024;21(6):757.
- Keys A, et al. "Indices of Relative Weight and Obesity." Journal of Chronic Diseases. 1972;25(6):329–343.
- Lavie CJ, et al. "Obesity and Cardiovascular Disease." Journal of the American College of Cardiology. 2018;72(16):1925–1934.
Frequently Asked Questions
What is a healthy BMI for a 40-year-old woman?▾
The standard healthy range of 18.5–24.9 applies at 40. However, given the body composition changes that begin in your late 30s, tracking waist circumference alongside BMI is increasingly important. A 40-year-old woman with a BMI of 24 but a waist above 35 inches should discuss her metabolic health with a doctor.
Get new calculators & guides by email
Occasional updates when we add a new calculator or publish a useful guide. No spam, unsubscribe anytime.
By subscribing you agree to our Privacy Policy.